LaTeX templates and examples — Two-column
Kürzlich
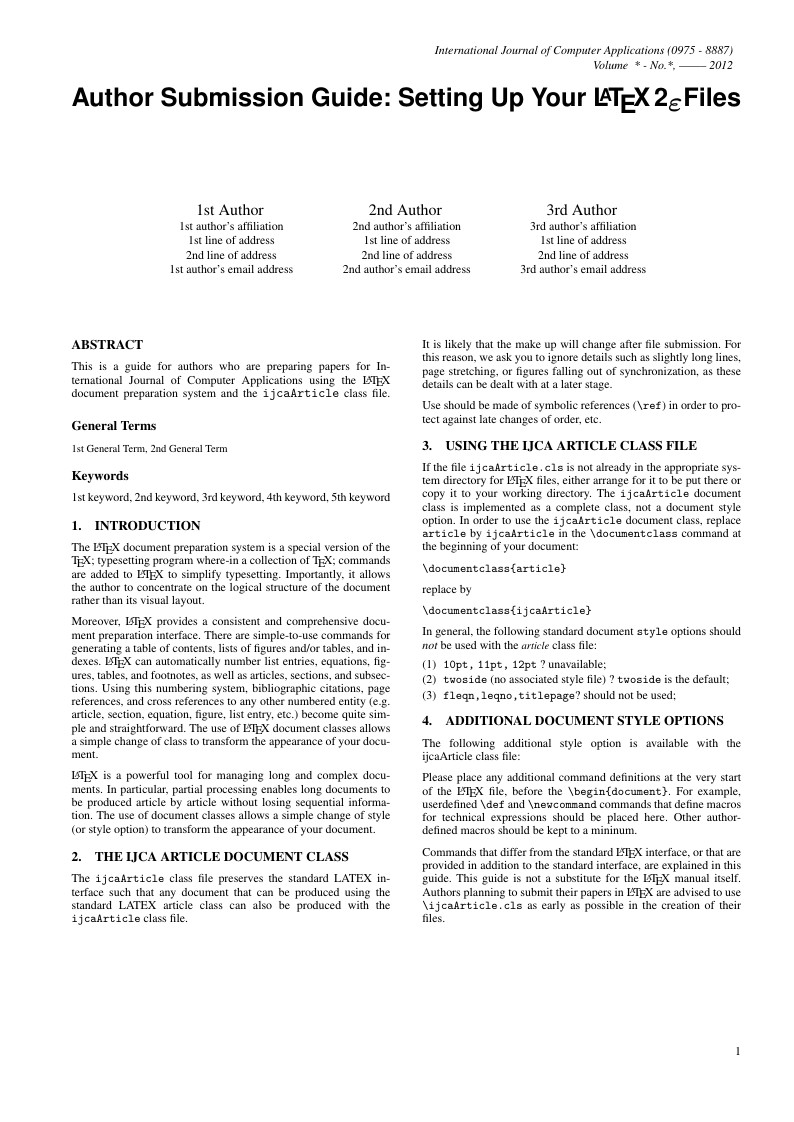
This is a guide for authors who are preparing papers for International Journal of Computer Applications using the LaTeX document preparation system and the ijcaArticle class file.
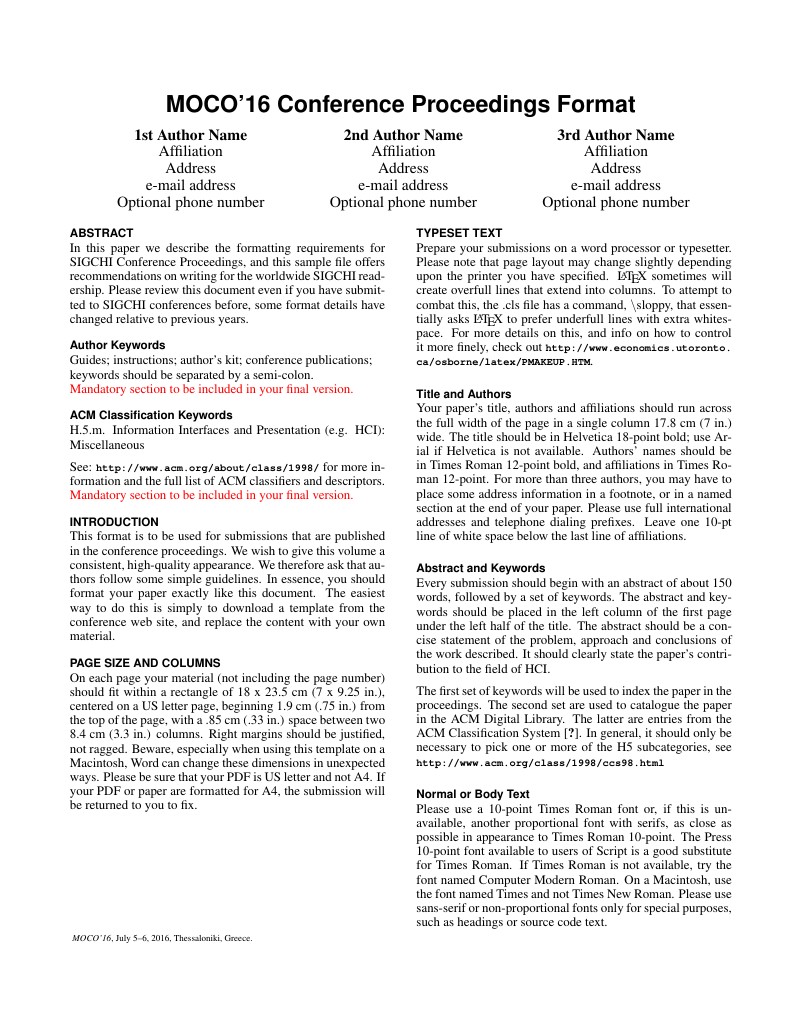
Downloaded from http://moco16.multimedia.uom.gr/index.php/papers/authors NOTE: The original template did not include a sample bibtex file
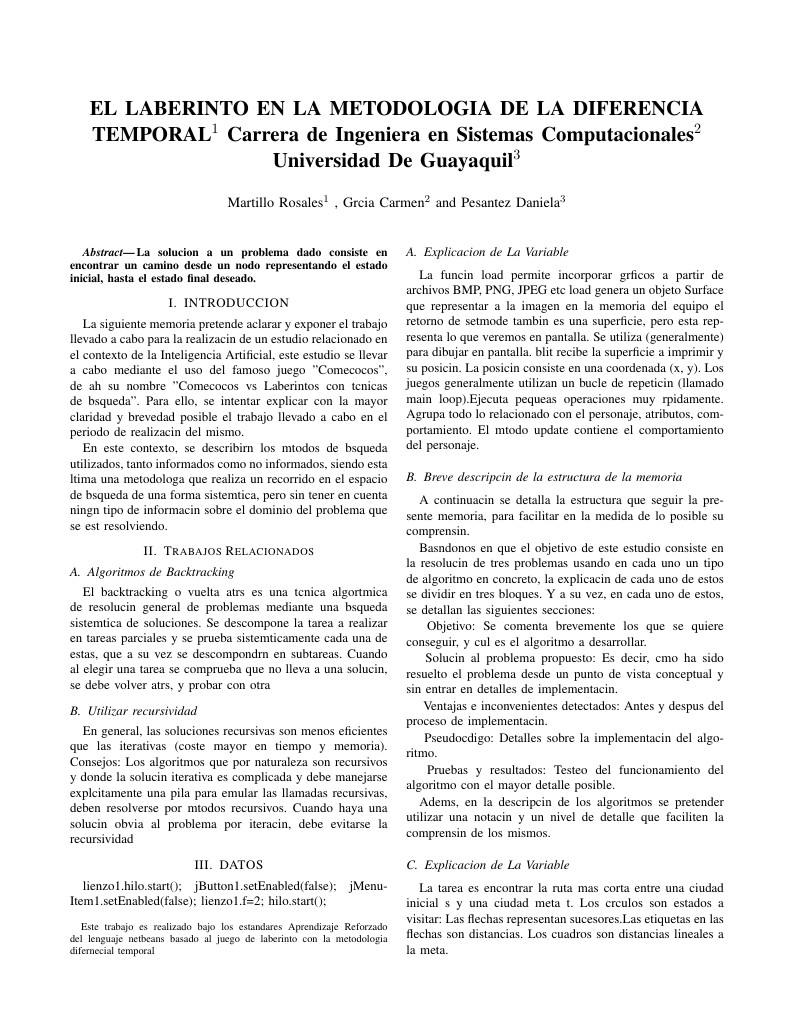
La solucion a un problema dado consiste en encontrar un camino desde un nodo representando el estado inicial, hasta el estado final deseado.
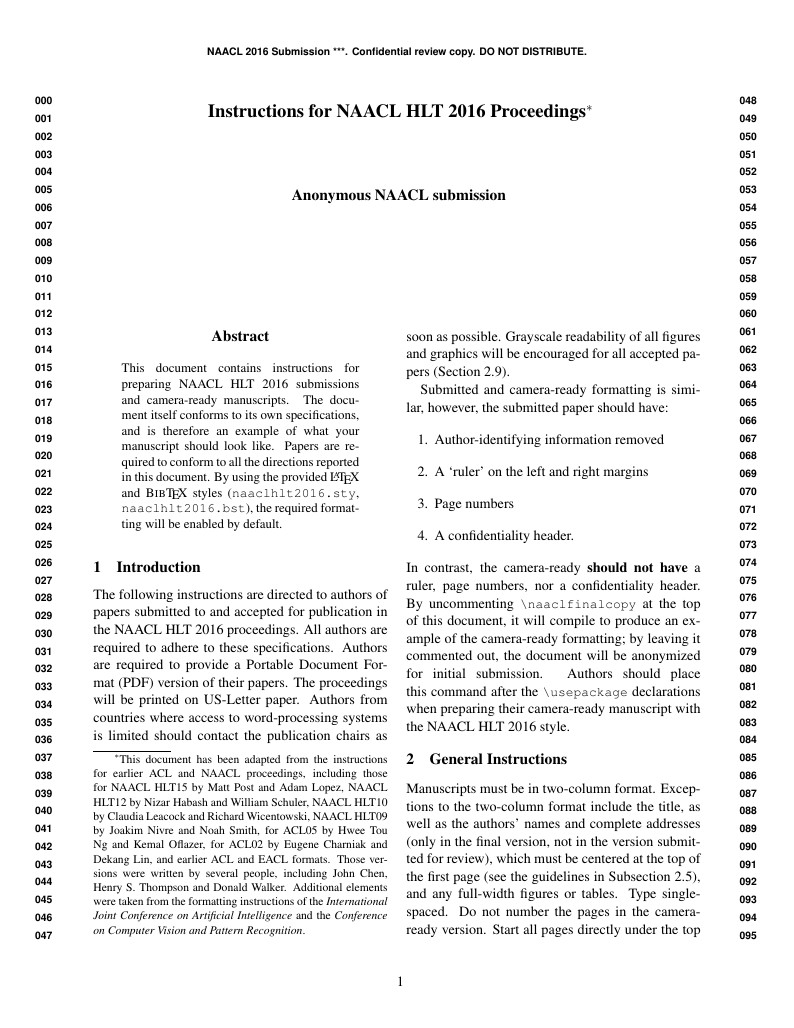
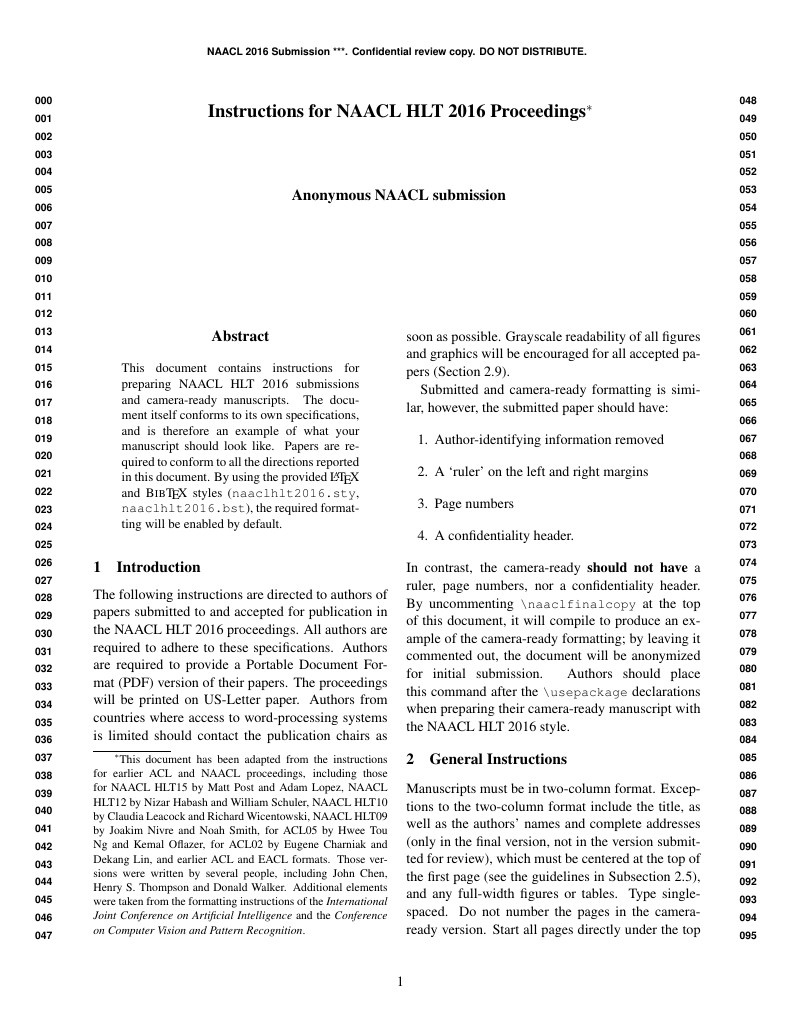
This document contains instructions for preparing NAACL HLT 2016 submissions and camera-ready manuscripts. The document itself conforms to its own specifications, and is therefore an example of what your manuscript should look like. Papers are required to conform to all the directions reported in this document. By using the provided LaTeX and BibTeX styles (naaclhlt2016.sty, naaclhlt2016.bst), the required formatting will be enabled by default.
This document contains instructions for preparing NAACL HLT 2016 submissions and camera-ready manuscripts. The document itself conforms to its own specifications, and is therefore an example of what your manuscript should look like. Papers are required to conform to all the directions reported in this document. By using the provided LaTeX and BibTeX styles (naaclhlt2016.sty, naaclhlt2016.bst), the required formatting will be enabled by default.
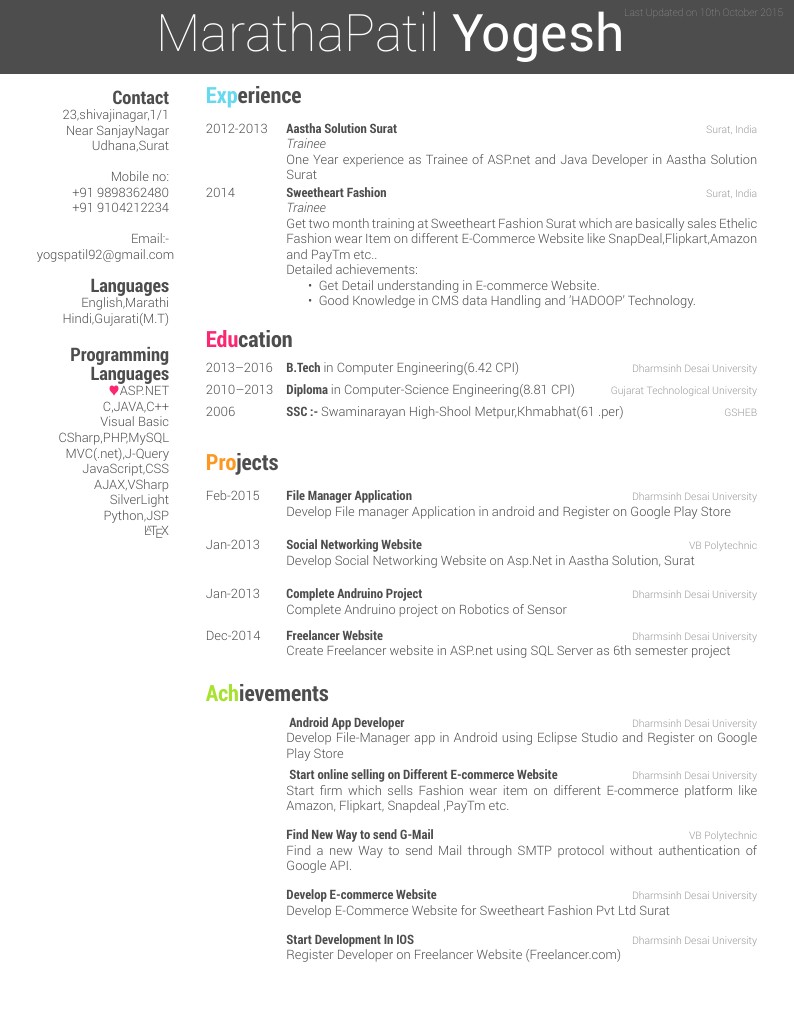
Resume of Yogesh Patil
\begin
Discover why over 25 million people worldwide trust Overleaf with their work.